Appearance
Sales summary
The sales summary is the main sales report. Its figures:
| Figure | Meaning |
|---|---|
| Gross sales | What was sold, at the sell price, before discounts |
| Refunds | What came back, at the price the customer was charged |
| Discounts | The discounts given |
| Net sales | Gross sales − discounts − refunds |
| Cost of goods | What the goods sold cost you, less restocked returns |
| Gross profit | Net sales − cost of goods. Margin is it as a % of net sales |
| VAT | The VAT on sales, less the VAT on returns |
| Sales | The number of sales (invoices) |
| Average sale | Net sales ÷ sales |
Who can do this: Anyone whose role has the Sales reports permission.
Step by step
Go to Reports › Sales summary and choose the period and shop. See How reports work.
Read the tiles. Each shows its change against the previous period of the same length: green when it's better, red when it's worse. The line under the tiles names that previous period.
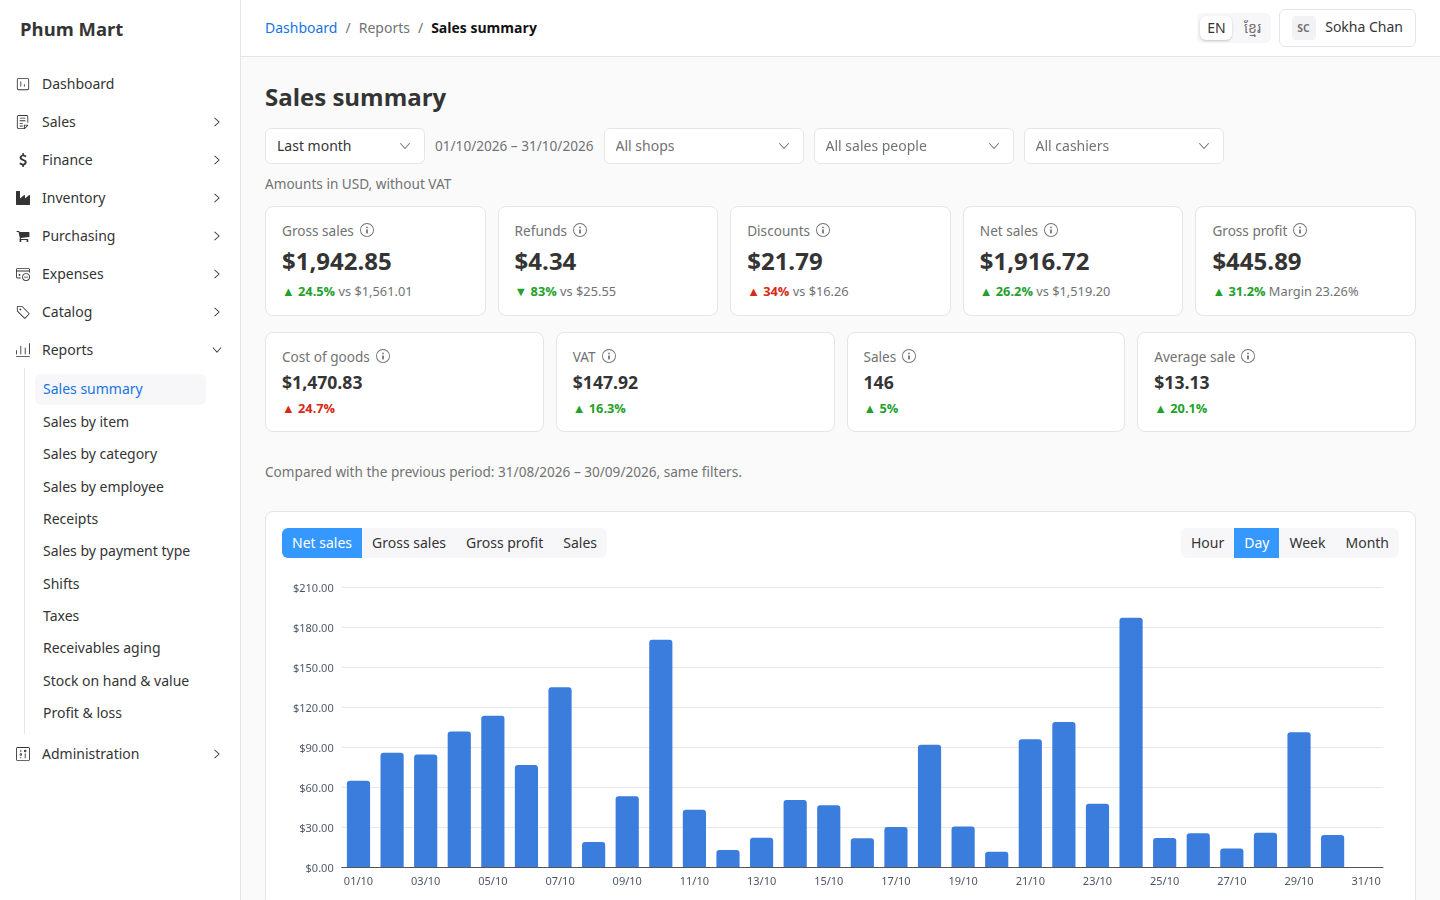
Use the chart to see the trend. Choose the figure above it: Net sales, Gross sales, Gross profit or Sales. Choose Hour, Day, Week or Month to group it. Hour shows which hours of the day sell most.
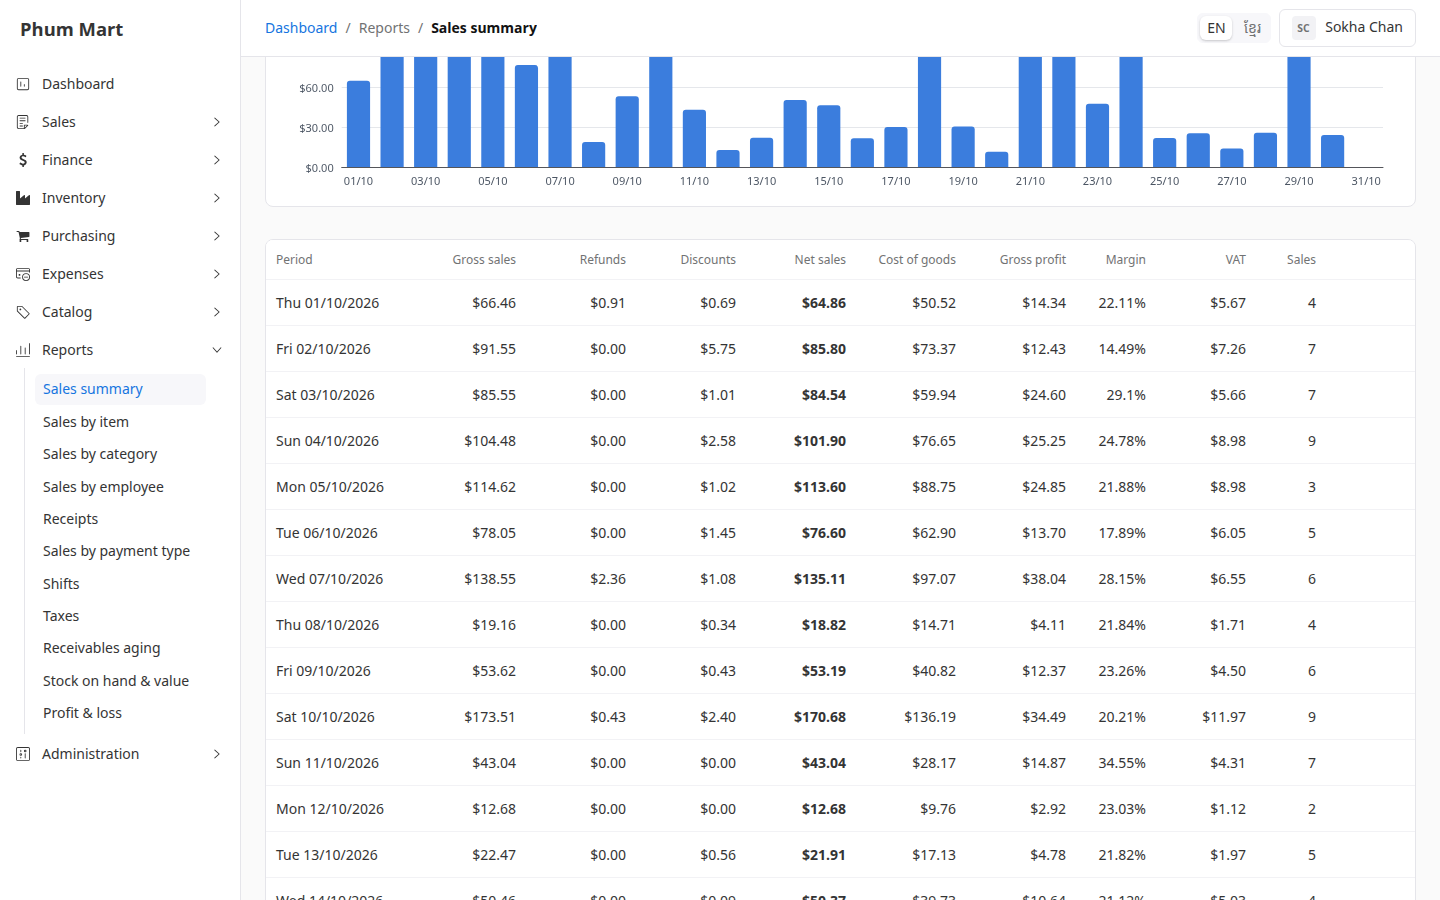
Scroll down to the table: one row per hour, day, week or month, with every figure, and a Total row.
Having trouble?
- A warning about cost: some variants have no cost, so their cost counts as 0 and the profit looks too high. Add their Cost. See Add product variants.
- Net sales don't match the money collected: net sales count when orders are confirmed, without VAT. Money counts when it's paid. See Sales by payment type.