Appearance
Read the dashboard
The dashboard is the first page after you sign in. It shows this month's figures, without VAT, in your base currency, and links to the reports and lists behind each one.
Who can do this: Everyone. Each part shows only if your role can see what's behind it, for example the sales figures need the Sales reports permission.
Step by step
Click Dashboard in the sidebar.
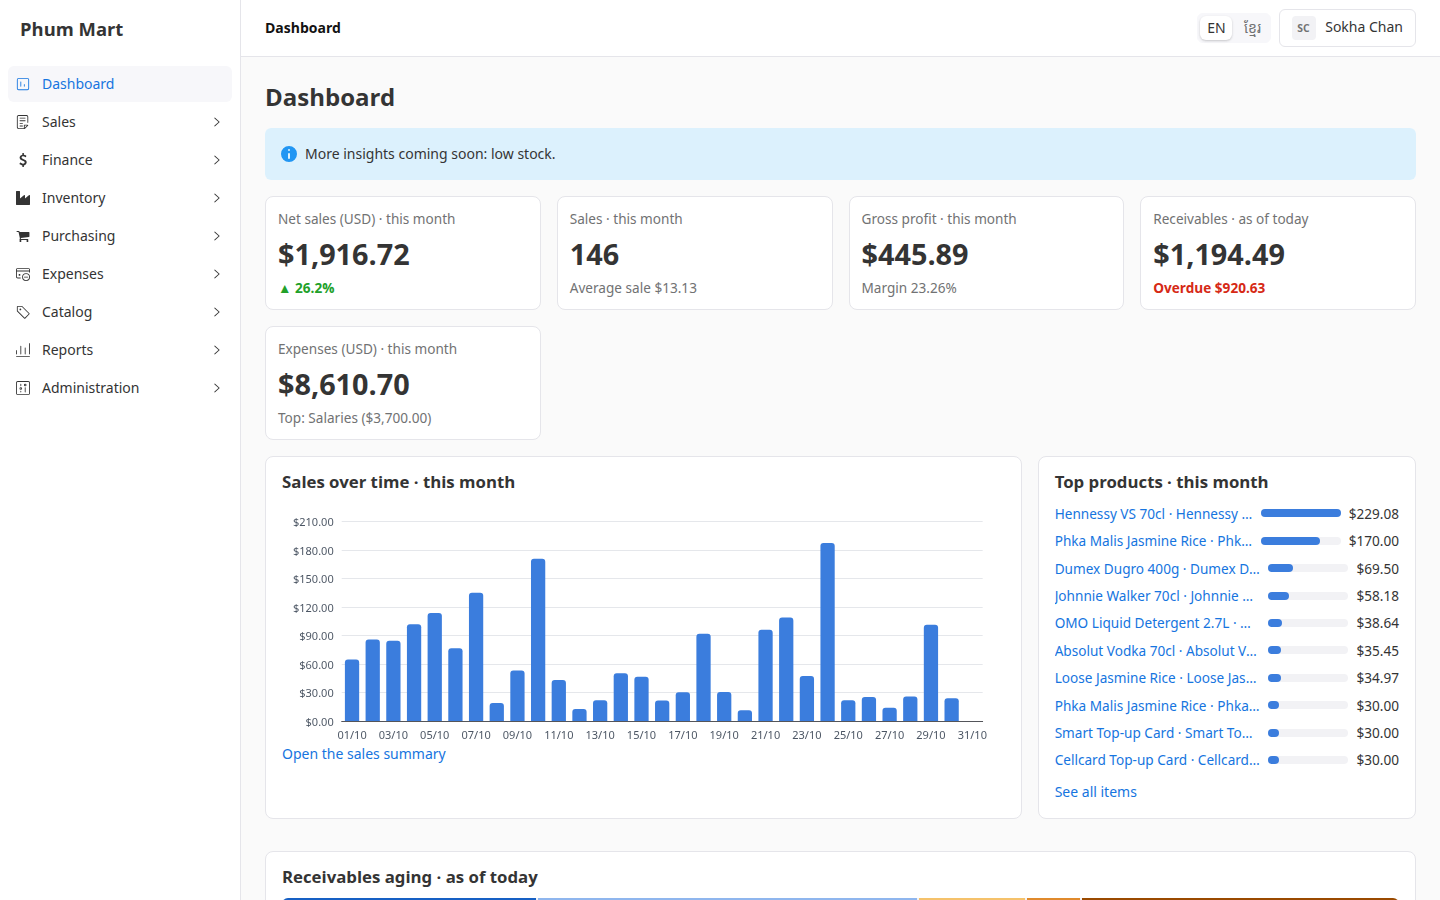
Read the tiles at the top:
- Net sales · this month: what was sold, after discounts and returns, with the change against last month.
- Sales · this month: the number of sales, and the average sale.
- Gross profit · this month: net sales minus the cost of the goods, and the margin.
- Receivables · as of today: what customers still owe, and how much of it is overdue.
- Expenses · this month: the posted expenses, and the biggest category.
Read Sales over time for each day of the month, and Top products for the items that sold most. Click Open the sales summary or See all items for the full reports.
Scroll down for Receivables aging, Pending work and Recent documents.
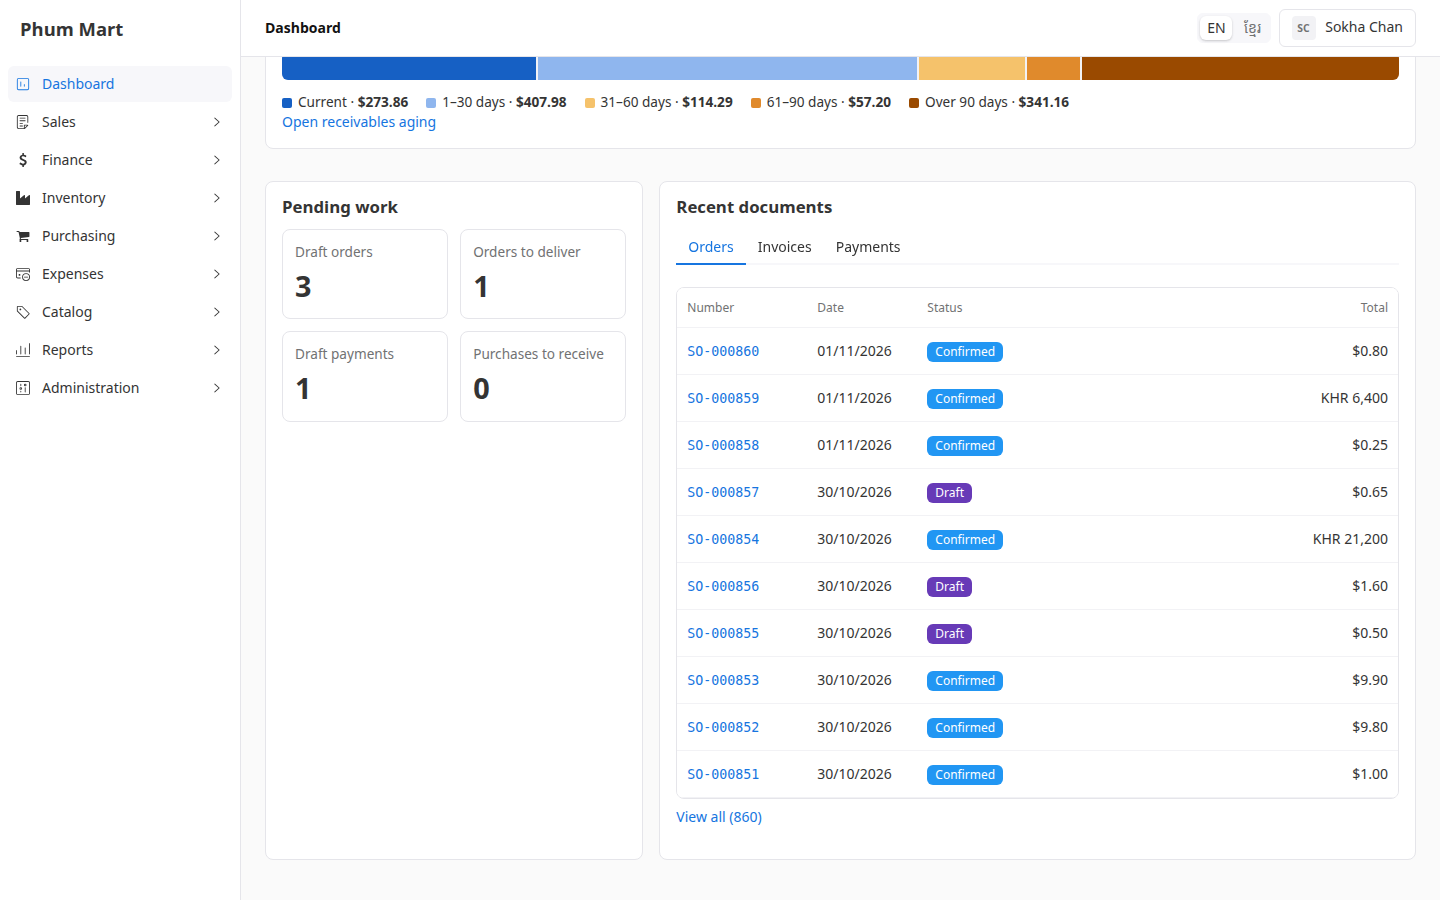
- Pending work counts the draft orders, orders to deliver, draft payments and purchases to receive. Click a counter to open that list, already filtered.
- Recent documents shows the latest orders, invoices and payments. Click one to open it.
Having trouble?
- A tile or section is missing: your role can't see it. Ask your administrator.
- The figures don't match an invoice total: the dashboard is without VAT, like the reports. Invoices include VAT.
- Last month's figures: the dashboard always shows this month. Use the reports for other periods.