Appearance
Sales by category
One row per category, with its sales and profit figures, and its Share of total net sales. A chart above the table shows the top categories. Each sub-category has its own row: its sales aren't added to its parent's. Its name shows its parent first, for example Beverages / Soft Drinks.
Who can do this: Anyone whose role has the Sales reports permission.
Step by step
Go to Reports › Sales by category, and choose the period and shop.
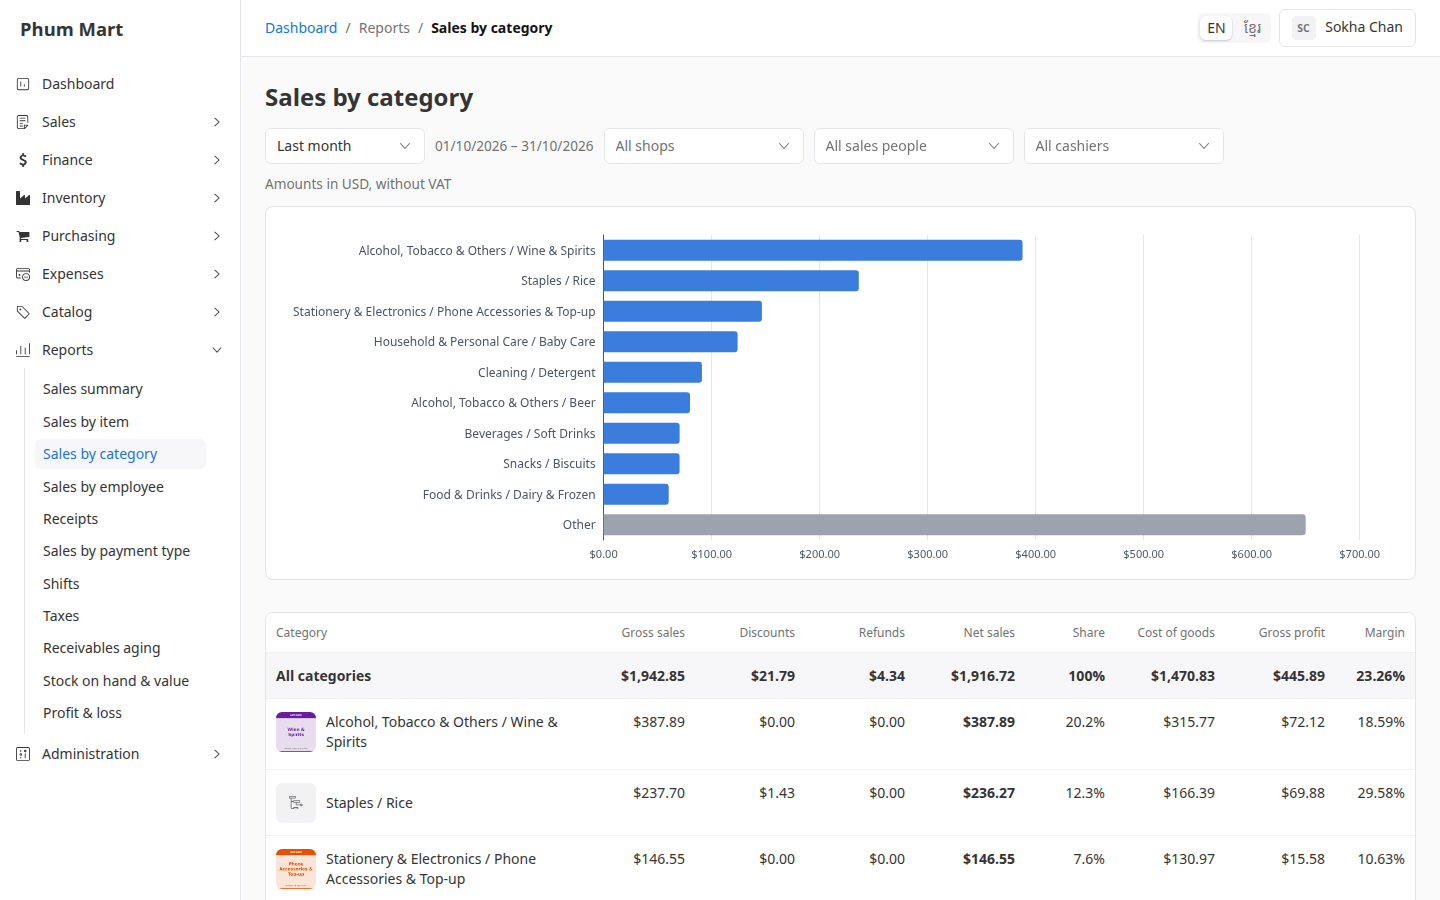
Read the All categories row for the totals, then each category, highest net sales first. Products with no category are last, as Uncategorised.
Click a category to see its products in Sales by item, for the same period and shop.
Having trouble?
- There are no quantities: categories mix units, such as pieces and kilograms, so their quantities can't be added up. See quantities in Sales by item.
- A category's total looks small: its sub-categories have their own rows. Add them up, or look at each one.